
Martin Storkholm Nielsen, VIA University College
The map ≠ the territory
The world is awash with sustainability models, value chain diagrams and business model visualizations showing us the flows, currents and systems of our businesses and their immediate environment. In academia, there is a predisposition for modelling the complexities in our disciplines. Given the authority instilled in the educational institution, our modelling can easily become theoretical, unactionable and rigid. But, as philosopher and engineer Alfred Korzybski once expressed it, “the map is not the territory” [1].
We might have the best intentions in academia, but we run the risk that these models become either simplistic or all-encompassing and complex for the “user” of the model. This might especially be true for SMEs, who are typically focused on keeping operations running smoothly and delivering value to the customer. If the models are not approachable and actionable, they will not be acted upon effectively having little to no impact on the business and thereby the industry.
Scoping for a target
As a partnering research and educational institute in the Ecolabnet, this is the challenge that we are facing, while trying to communicate potential issues and areas that SMEs potentially have to be aware of, when applying new circular strategies to their business models.
What frameworks do we draw on? What can the SMEs relate to? What is too much information—and too little? What should be focused on? And finally, how do we visualize it?
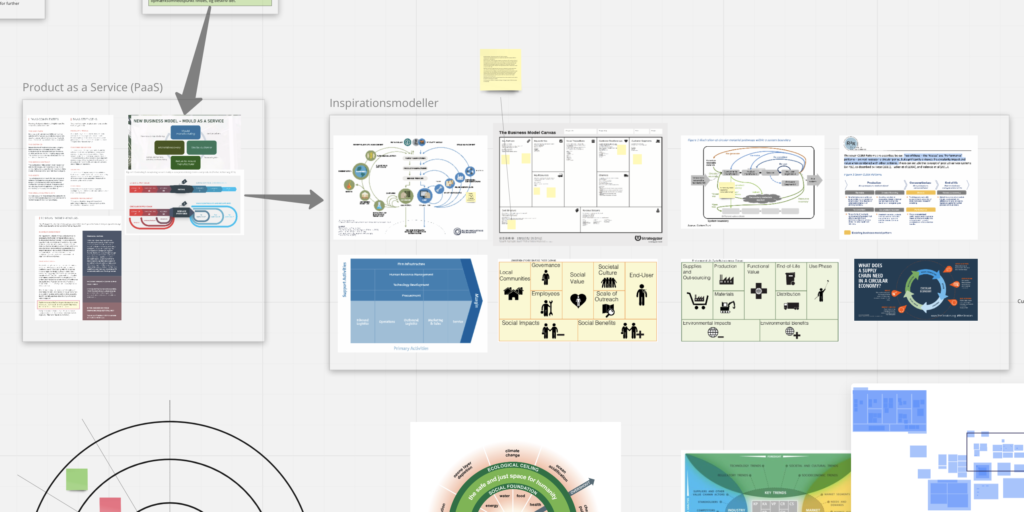
These creative processes can seem somewhat chaotic—especially in the beginning. Our process was no outlier here. Being a team representing multiple disciplines, our conversations—based on both qualitative and quantitative research performed in Denmark and the other 5 partner countries—took us far and wide during our scoping process. What happens to the logistics side of things, when we change our business model to one based on a Product-as-a-Service? What happens to our brand? How must we build and support the relationships with our customers or those with our partners?
This is exactly the might of canvases. They provide enough structure to get us on the same page, whether we are from R&D, sales or finance. Yet, they are open enough for us to have rich and meaningful conversations about the various aspects of our company. Remember “the map is not the territory”—there is no truth in the canvas, only landmarks and other pointers to help us find our bearings, set a course and navigate according to those two parts.
Canvas as compass and conversation as engine for progress
Building on the canvas approach (Business Model Canvas etc.) and asking, rather than telling, we believe that by providing questions and general awareness points within the structure of a business model canvas, the companies—who are the experts of their own business—can guide themselves, at least initially.
As the initial steps are taken and the organization starts to gain alignment and momentum, VIA University College and the rest of the ECOLABNET partners will be ready to guide the companies along their new paths towards more sustainable practices—being the front runners and leading lights in their industries.
We are looking forward to sharing our visualization with you and to help you navigate through these new unchartered waters of the future.
[1] A. Korzybski, Science and Sanity: An Introduction to Non-Aristotelian Systems and General Semantics.